A backtest with a beautiful equity curve, 2.5 profit factor, and 12% max drawdown tells you one thing: that combination of parameters, on that specific data, in that exact period, produced those numbers. It tells you absolutely nothing about what happens next.
Free Monte Carlo Simulation Online for MT4, MT5, cTrader tests:
https://ergodiclabs.co/monte-carlo/
Curve fitting — also called overfitting or over-optimization — is when an EA’s parameters have been tuned so precisely to historical data that the strategy has learned the noise rather than the signal. The result is a backtest that looks exceptional and a live account that bleeds money from day one.
The challenge is that curve fitting isn’t binary. Every optimized EA sits somewhere on a spectrum between “robustly adapted to market structure” and “memorized the past.” The question isn’t whether your EA is curve fitted. The question is how badly, and whether there’s still a genuine edge underneath.
Here are five statistical tests that help answer that question — without needing the EA’s source code.
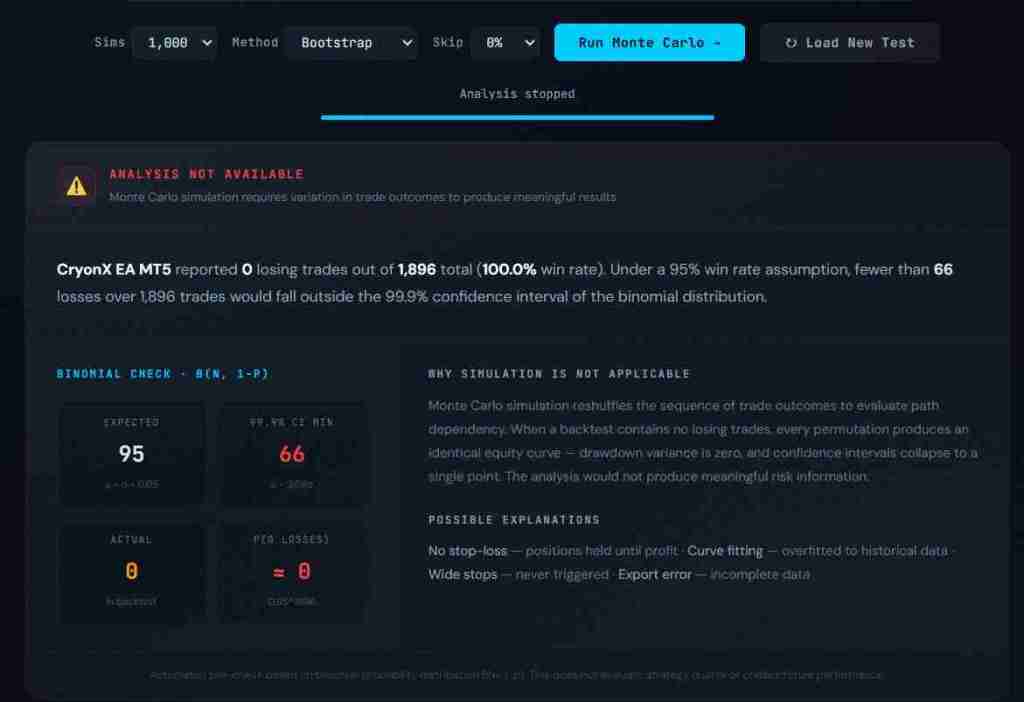
1. The Monte Carlo Drawdown Test
This is the single most revealing test you can run on any backtest, and it requires nothing beyond the trade list.
The concept: your backtest produced one equity curve from one specific ordering of trades. Reshuffle those same trades into 1,000 different random sequences and you get 1,000 alternate equity curves. The trades are identical — same profits, same losses — but the paths are different. Some sequences cluster losses at the start. Others cluster them in the middle. The distribution of drawdowns across these sequences tells you how much your original result depended on lucky ordering.
What to look for: compare the original backtest drawdown to the 95th percentile drawdown from the Monte Carlo distribution. If the 95% confidence interval drawdown is 1.5x the original, that’s normal. Most strategies show this ratio. If it’s 3x or higher, the original backtest sequence was unusually favorable — the one path that happened to avoid the worst clustering. That’s not evidence of curve fitting by itself, but it tells you the strategy’s real-world risk is significantly higher than the backtest suggests.
The ratio between original and 95% CI drawdown is sometimes called the Risk Multiplier. A multiplier below 0.5 means you’d need to cut your lot size in half just to maintain the drawdown level shown in the backtest. That’s a strategy where the backtest is painting a dangerously optimistic picture.
You can run this test right now — upload any MT4, MT5, or cTrader backtest report to our [free Monte Carlo analyzer](/monte-carlo/) and the drawdown confidence intervals are calculated automatically.
2. The Holding Time Asymmetry Test
This test catches a specific and common form of disguised curve fitting: strategies that hold losing trades until they recover.
The method: calculate the average holding time for winning trades and the average holding time for losing trades. In a clean strategy, these numbers should be roughly comparable. A trend-following system might hold winners longer than losers (which is generally healthy — letting profits run and cutting losses short). But the reverse pattern is a warning sign.
If the average losing trade is held 2x longer than the average winning trade, the EA is almost certainly waiting for losers to recover rather than exiting at a defined stop loss. This is a form of curve fitting because it only works when the historical data contains enough reversals for the “hold and hope” approach to succeed. In live trading, the one time it doesn’t reverse is the trade that wipes out months of small wins.
The holding time ratio is one of the 17 validation tests built into [Edge Matrix](/features/), and it’s one of the strongest predictors of live vs. backtest performance divergence.
3. The Win Rate vs. Profit Factor Cross-Check
This is a simple sanity check that requires nothing more than two numbers from the backtest report.
Win rate and profit factor are mathematically related. If you know the win rate, you can estimate what the profit factor should be for a strategy with a genuine edge — and flag results that don’t make sense.
The relationship: Profit Factor = (Win Rate × Average Win) ÷ ((1 − Win Rate) × Average Loss)
Here’s what looks normal:
- 40-50% win rate with profit factor 1.3-2.0: typical trend-following strategy. Wins are larger than losses, compensating for the lower hit rate.
- 55-65% win rate with profit factor 1.2-1.8: typical mean-reversion strategy. Win rate is higher, individual wins are smaller relative to losses.
- 70-80% win rate with profit factor 1.5-3.0: possible, but the average loss should be significantly larger than the average win. If the profit factor is above 2.0 with a 75%+ win rate, double-check the average loss size.
Here’s what should raise questions:
- 85%+ win rate with profit factor above 2.0: this combination almost never occurs in legitimate strategies. Most strategies achieving 85%+ win rates do so by taking small profits and absorbing large occasional losses (which is the martingale pattern we covered in [our martingale detection article](/the-90-win-rate-trap-how-martingale-eas-destroy-accounts-in-silence/)). A high win rate AND high profit factor usually means the EA was optimized until the backtest period’s losses were minimized — classic curve fitting.
- Win rate below 30% with profit factor above 3.0: extremely rare in practice. While a small number of legitimate breakout strategies operate here, an EA reporting these numbers has likely been optimized to capture a handful of large moves in the backtest data. Remove one or two of those outlier trades and the entire backtest may collapse.
The point isn’t that any specific combination is impossible. The point is that certain combinations are statistically improbable, and improbable results from an optimized system should trigger further investigation.
4. The Sample Size Reality Check
This is the test most traders skip entirely, and it’s arguably the most important.
Statistical significance in trading requires a minimum number of trades. Below that threshold, no metric — win rate, profit factor, drawdown, Sharpe ratio — carries meaningful predictive weight. The backtest numbers might look good, but they could easily be the result of random chance.
The rough thresholds:
- Under 30 trades: essentially meaningless. Any apparent pattern is noise. You cannot draw conclusions about a strategy from 30 trades any more than you can judge a coin’s fairness from 30 flips.
- 30-100 trades: preliminary only. Patterns might be emerging, but confidence intervals are extremely wide. A “65% win rate” over 60 trades has a 95% confidence interval of roughly 52%-77%. That range includes strategies that are barely profitable and strategies with a strong edge — you genuinely can’t tell which you have.
- 100-200 trades: the minimum for cautious evaluation. You can start to trust the major metrics (win rate, profit factor) with moderate confidence, but secondary metrics (consecutive losses, drawdown patterns) are still noisy.
- 200+ trades: statistically meaningful. Confidence intervals tighten considerably. If the numbers look good at 200+ trades, they’re more likely to reflect a genuine edge.
- 500+ trades: high confidence. At this point, the law of large numbers is working in your favor. If the strategy is still profitable after 500 trades, random chance becomes an increasingly unlikely explanation.
The curve fitting connection: over-optimized EAs often have suspiciously few trades. The optimizer found a parameter set that captured a specific set of historical moves — and because those specific moves are rare, the trade count is low. If an EA backtested over 5 years produces only 40 trades, it’s almost certainly waiting for very specific conditions that happened to occur in the backtest data. That’s textbook curve fitting.
flags this automatically — if your backtest has fewer than 50 trades, the analysis includes a sample size warning because the statistical foundation for any conclusion is weak.
5. The Drawdown-to-Profit Trajectory Test
This test looks at how the EA accumulates profit relative to the drawdown it experiences along the way. It’s less commonly discussed but extremely effective at catching a subtle form of overfitting.
The concept: in a robust strategy, the equity curve should show a reasonably consistent rate of profit accumulation relative to drawdown. The ratio of current drawdown to total accumulated profit should stay within a predictable range throughout the backtest.
What curve fitting looks like: the equity curve shows extended flat or losing periods punctuated by one or two sharp recovery spikes. The overall result looks profitable, but 60-80% of the total profit came from a small cluster of trades in a specific market condition. Remove that cluster — or imagine those conditions don’t repeat — and the strategy is flat or negative.
A practical way to check: mentally divide the backtest into quarters. Is the strategy profitable in at least three of the four quarters? If the entire backtest profit comes from one quarter, the EA may have been optimized to capture a specific market move (a strong trend, a volatility spike, a particular range-bound period). That’s not a strategy — it’s a historical artifact.
This is related to what’s called temporal stability — whether the strategy’s performance is consistent across different time periods rather than concentrated in one favorable window. It’s one of the advanced tests in Edge Matrix App that goes beyond what Monte Carlo simulation alone can reveal, because Monte Carlo reshuffles trades but preserves the original trade distribution. Temporal stability testing asks a different question: was the edge present throughout the test, or only during specific conditions?
Putting It All Together
No single test definitively proves curve fitting. But when multiple tests raise flags simultaneously, the probability of overfitting increases substantially.
A realistic assessment process:
Run the Monte Carlo drawdown test first — it’s the fastest and most broadly informative. If the 95% CI drawdown is more than 2.5x the original, slow down. Check the sample size. If there are fewer than 100 trades over multiple years, be cautious about any conclusion. Look at the holding time ratio. If losers are held twice as long as winners, that’s a structural problem independent of the equity curve shape. Cross-check win rate against profit factor. If the combination sits in the statistically improbable zone, assume over-optimization until proven otherwise. Finally, check temporal stability. If the profit is concentrated in one time period, the strategy is likely fitted to that period’s conditions.
A strategy that passes all five tests isn’t guaranteed to work in live trading — execution, spread, slippage, and regime changes can still erode performance. But a strategy that fails multiple tests is almost guaranteed to underperform its backtest.
Test Your EA Now
You can run tests now for free. Upload any MT4, MT5, or cTrader backtest report to the — you’ll get drawdown confidence intervals, the holding time ratio, martingale detection, sample size analysis, and a composite robustness score. Everything runs in your browser. Your data never leaves your machine.
For the complete picture — including temporal stability, parameter sensitivity analysis, edge decay detection, and 14 additional validation tests — that’s what [Edge Matrix](/pricing/) is built for. One tool, 17 tests, zero guesswork.
The difference between a profitable algorithm and an expensive lesson is often just statistics. Test before you trade.


Hozzászólás