Apex DayTrader EA
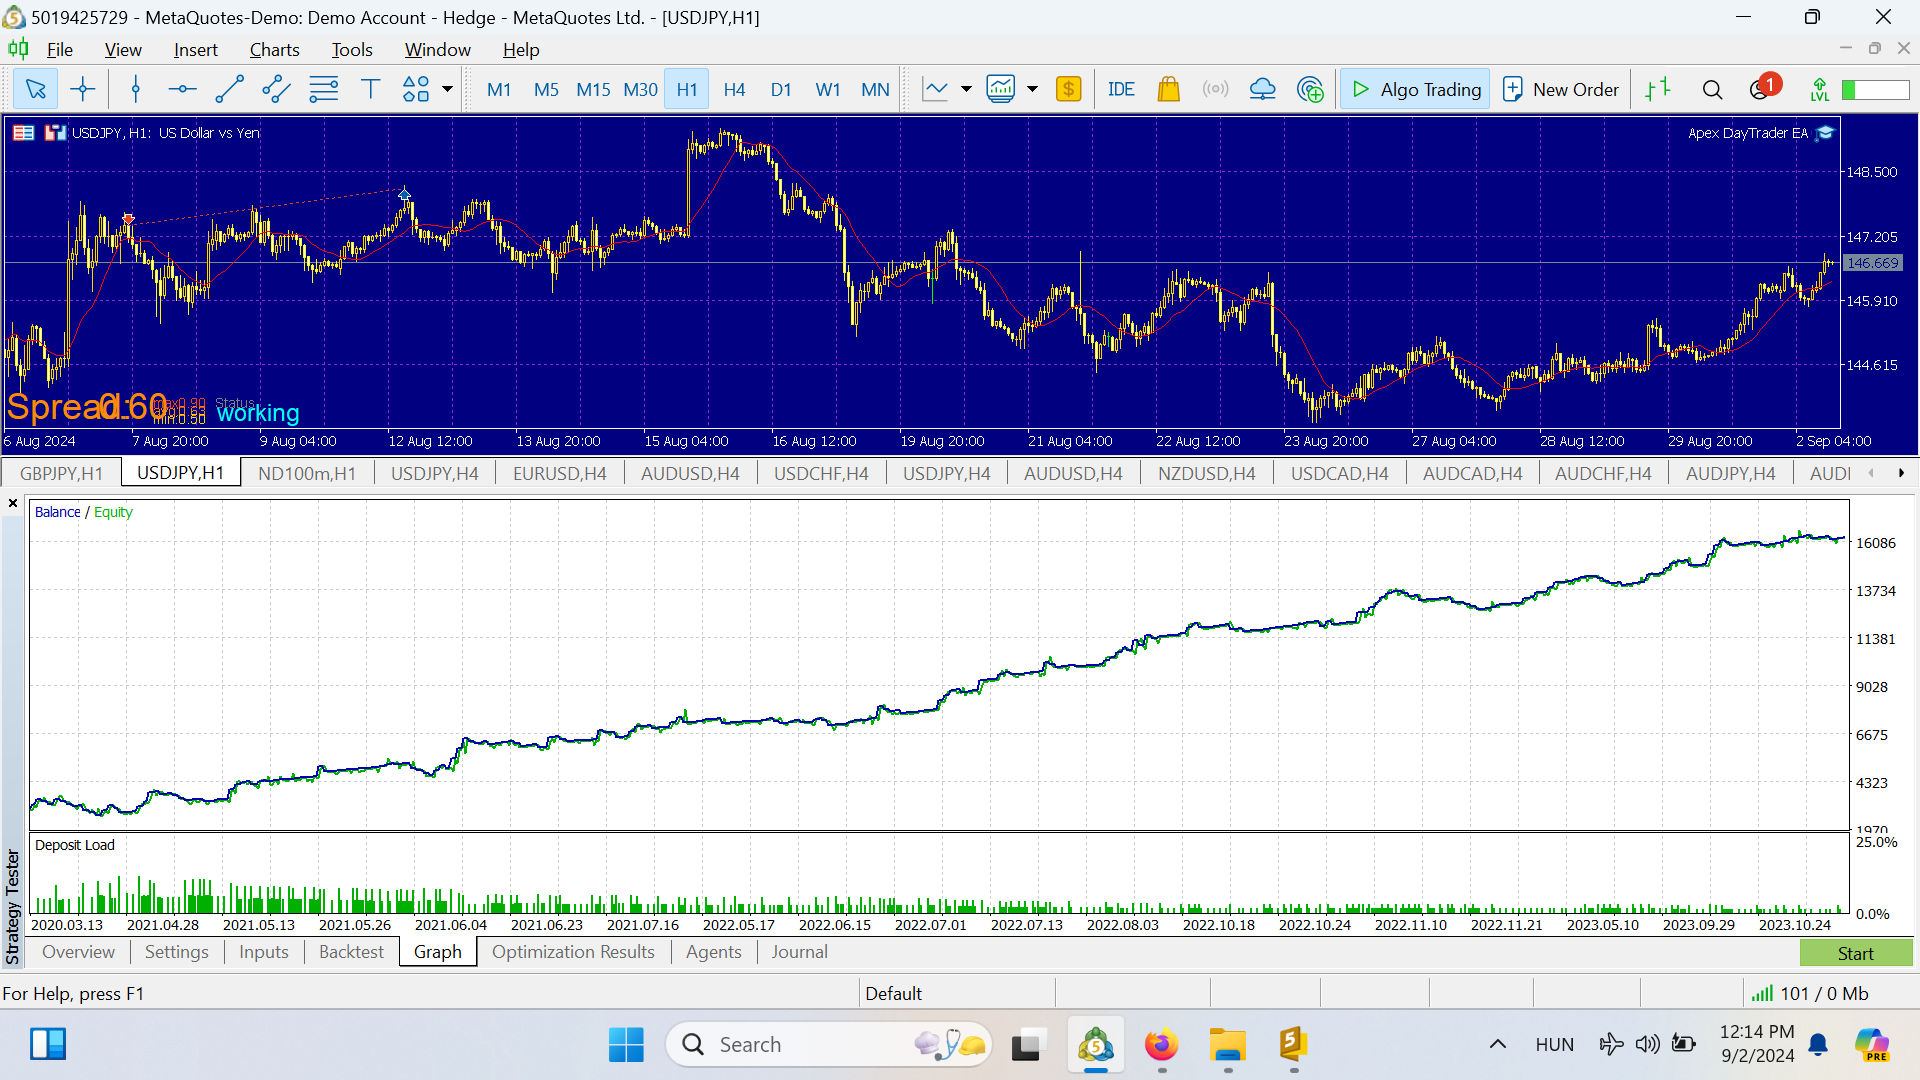
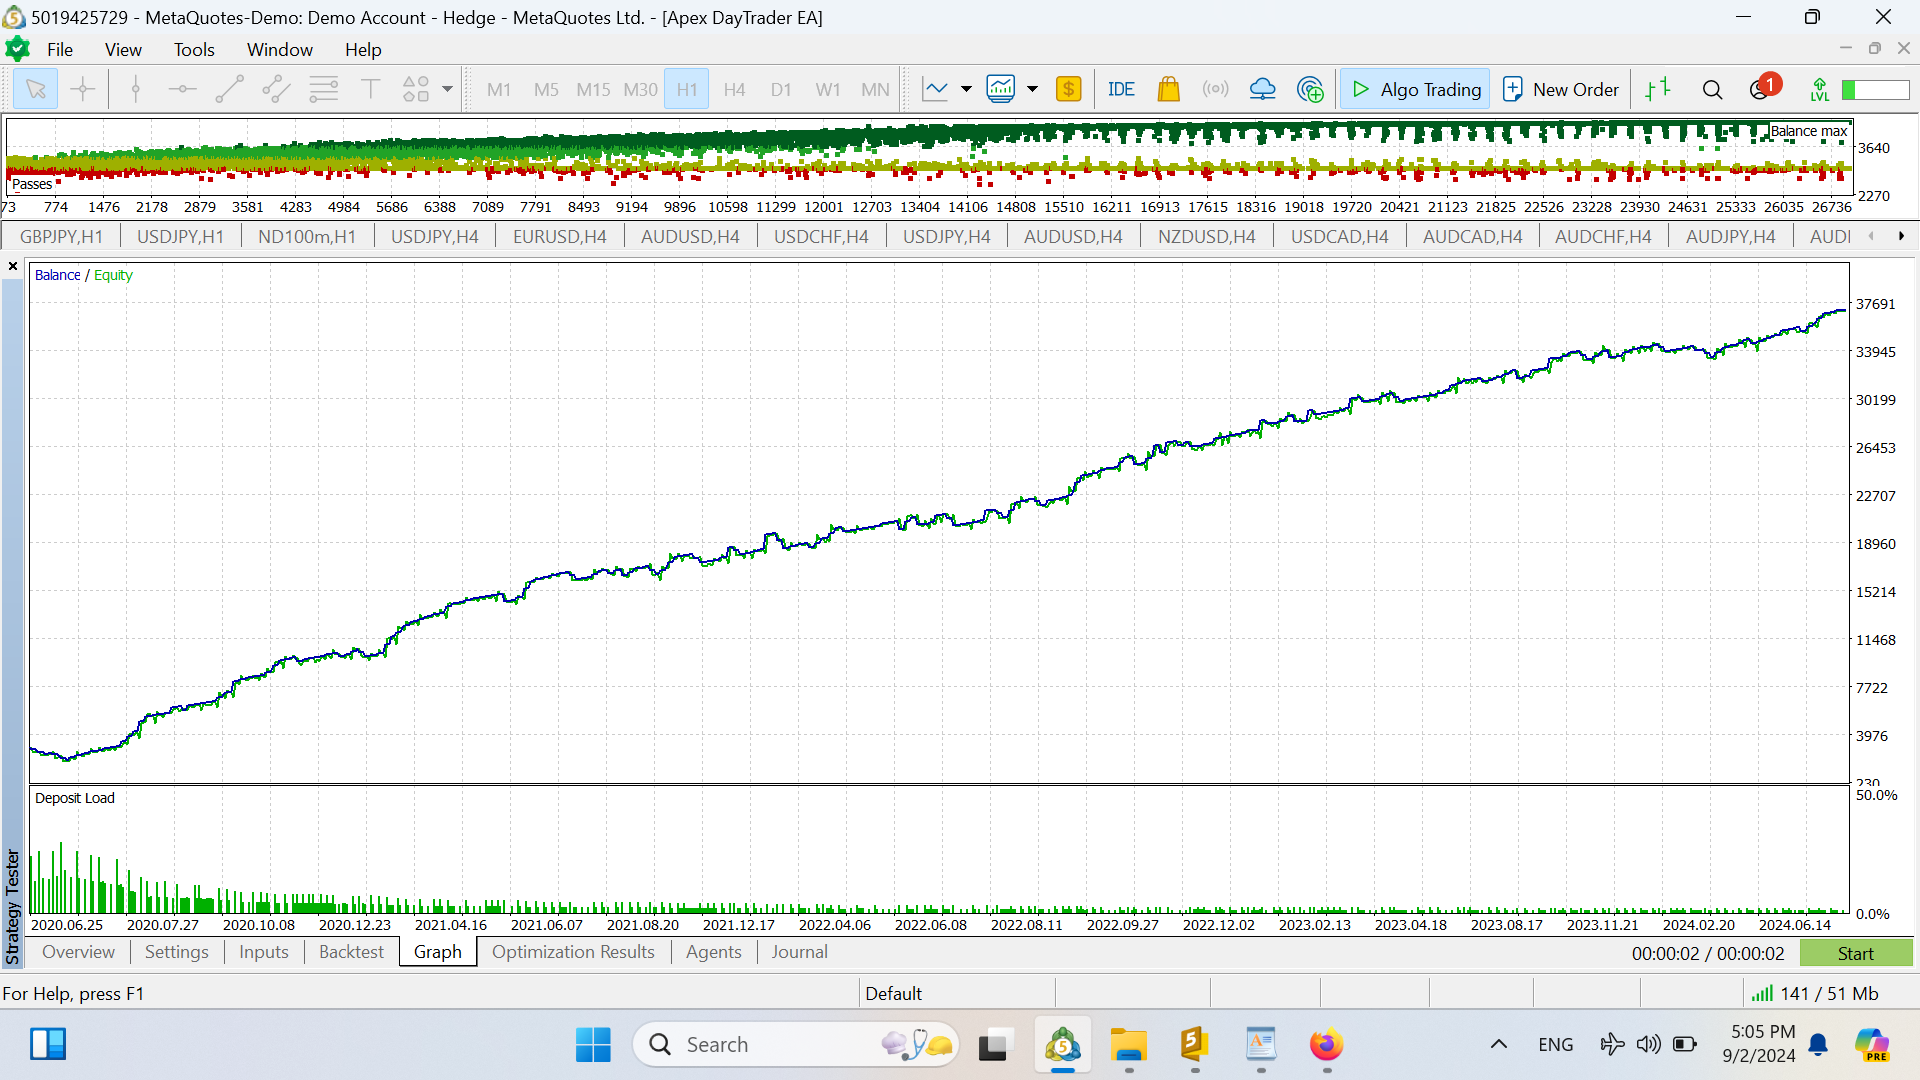
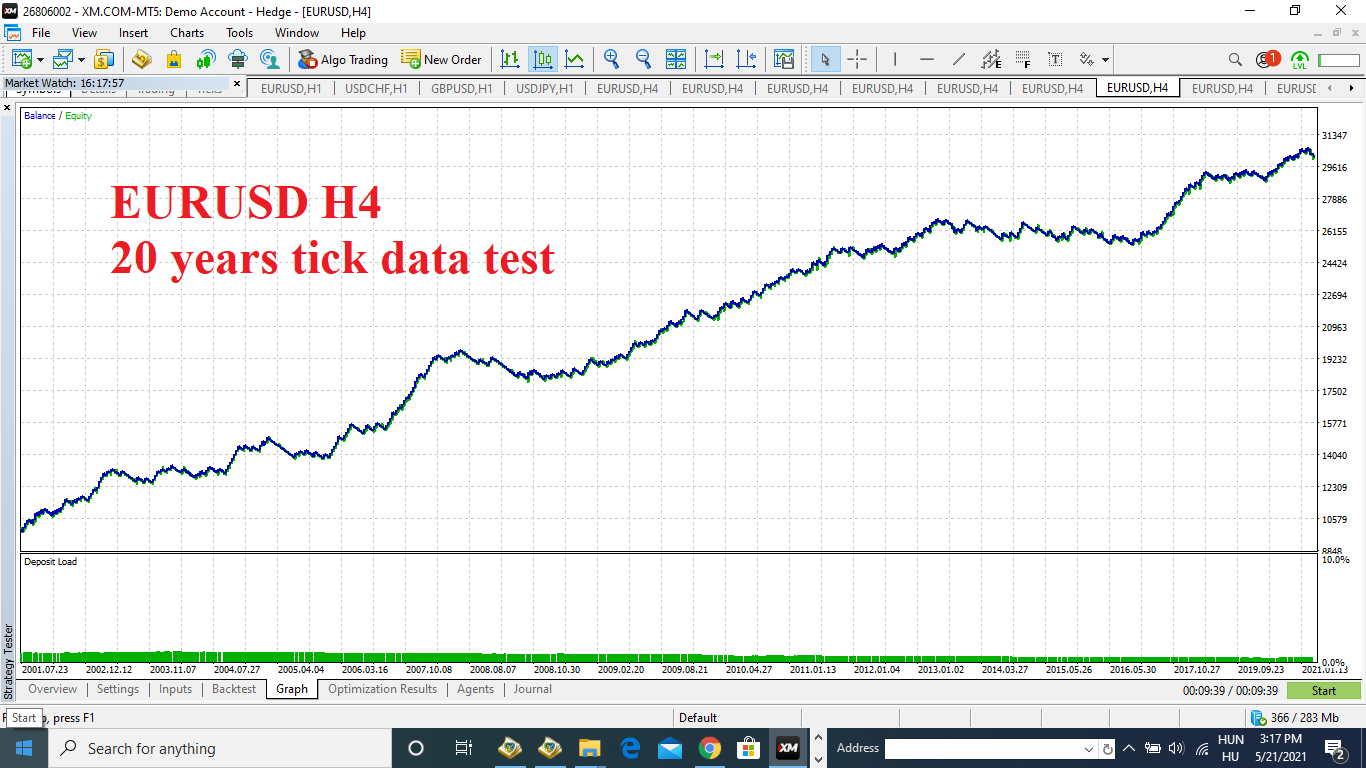
Candlestick pair comparisons with EMA, ADX and RSI confirmation, fixed stop on every trade. Edge Matrix scores it 94/100 across 2,612 trades — the largest sample in the range — with 18 of 19 tests passing.
A backtest shows one sequence of trades — the one that happened. A Monte Carlo simulation reshuffles that sequence thousands of times and asks whether the result survives. Where a system has been through it, the robustness score is published here. Live gains sit on Myfxbook, where they carry their dates and trade counts with them.
Candlestick pair comparisons with EMA, ADX and RSI confirmation, fixed stop on every trade. Edge Matrix scores it 94/100 across 2,612 trades — the largest sample in the range — with 18 of 19 tests passing.
Secret Equation Supertrend on gold, MT5 native, with two live accounts on Myfxbook. Edge Matrix scores it 94/100 over 685 trades and 7.13 years; every Monte Carlo simulation survived.
Gold specialist with the full MQL5 source included, so the logic can be read and modified. Best backtest profit factor 2.71 on H1 over 7 years.
Scores every setup across six components and takes nothing below 65 out of 100. The only system here with a published maximum drawdown.
Running on a funded The5ers prop account, verifiable on Myfxbook. 50,000 bootstrap simulations return a robustness score of 77/100 with every simulation profitable.
Trades Hammer, Engulfing, Doji and Pin Bar formations as each candle closes, filtered by trend and momentum, across six tested pairs.
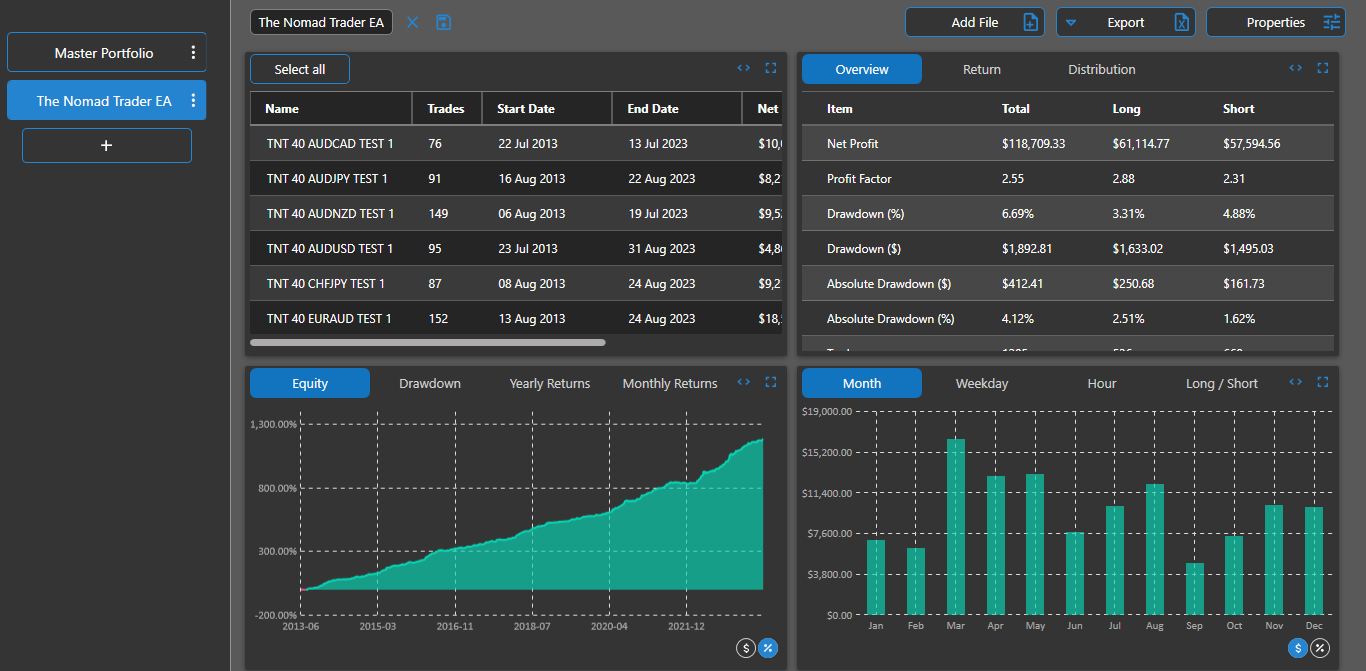
Candle patterns with EMA and ATR, no lagging indicator on the entry signal. The only system here to pass all 19 Edge Matrix tests, across 1,068 trades and 20.08 years.
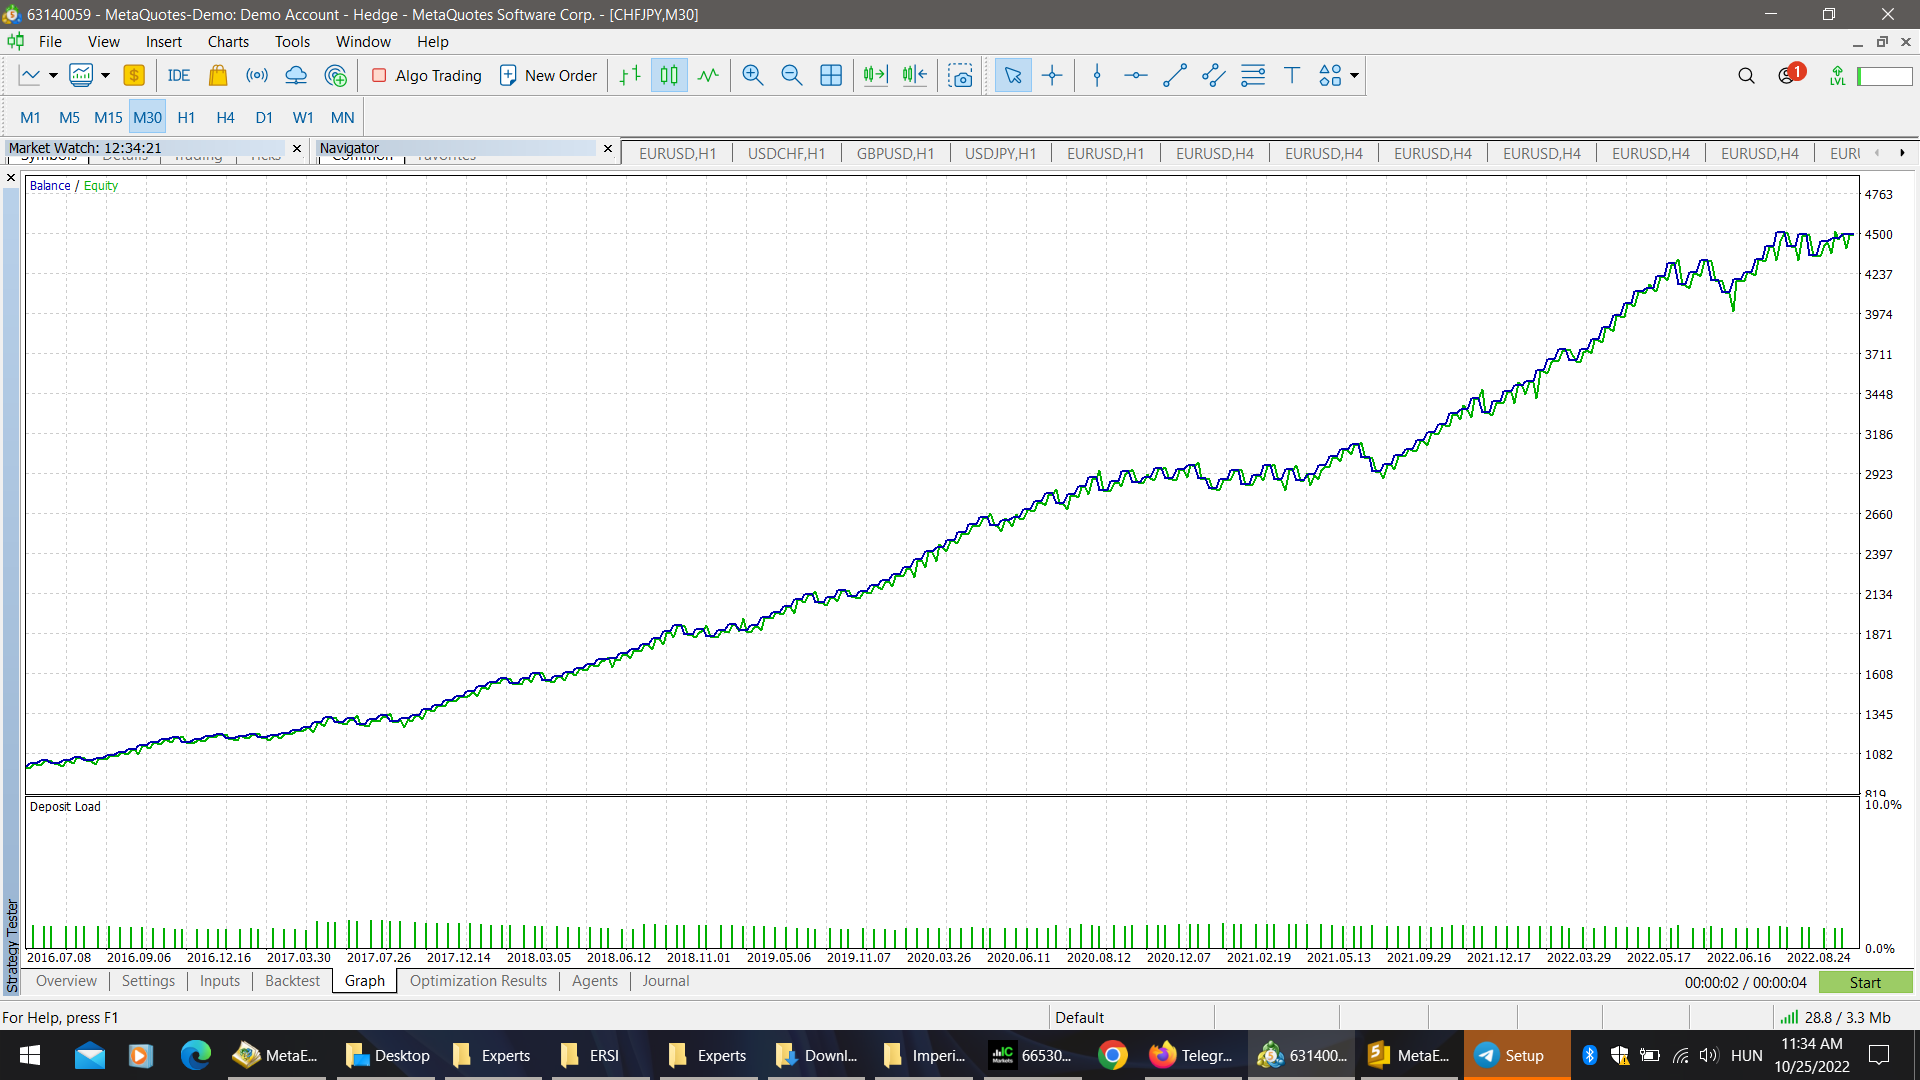
Candlestick signals confirmed by a six-EMA stack with ADX, CCI and Awesome Oscillator. Backtested over 10 years on 99.9% tick data.
A backtest tells you what one particular sequence of trades produced. A Monte Carlo simulation takes those same trades, reshuffles the order thousands of times, and reports how the result holds up — the drawdown distribution, the confidence intervals, and how many of the simulated runs finished profitable.
A high score means the result did not depend on lucky ordering. AutoTrade Gold returns 86 out of 100 with a 100% survival rate across 2,000 block-bootstrap simulations. Apex DayTrader returns 76 on the largest sample here, 2,612 trades. Powerful Price Action returns 72 — a lower score, published anyway, because its report shows a much wider Monte Carlo drawdown envelope than its history suggests. Every full report is linked on its card.
Size against the MC P95 figure, not the historical drawdown. That is what these reports advise, and it is why the P95 number is printed on the card next to the score rather than left inside the PDF. Where a column is dashed, no Monte Carlo result has been published for that system yet — that is a gap in the testing, not a verdict on the system.
Gain percentages. They live on Myfxbook alongside the drawdown, the trade count and the dates — the context that makes them mean anything.
Guarantees. Past performance, backtested or live, does not indicate future results. Every system here can lose money.
Estimates dressed as measurements. Where a figure has not been published, this page says so.