Spectrum
Trend
Pro MTF
50 moving averages. 8 timeframes. One live dashboard. The rainbow spectrum that makes market sentiment impossible to misread — now built natively for cTrader in C#.
What it looks like on your chart
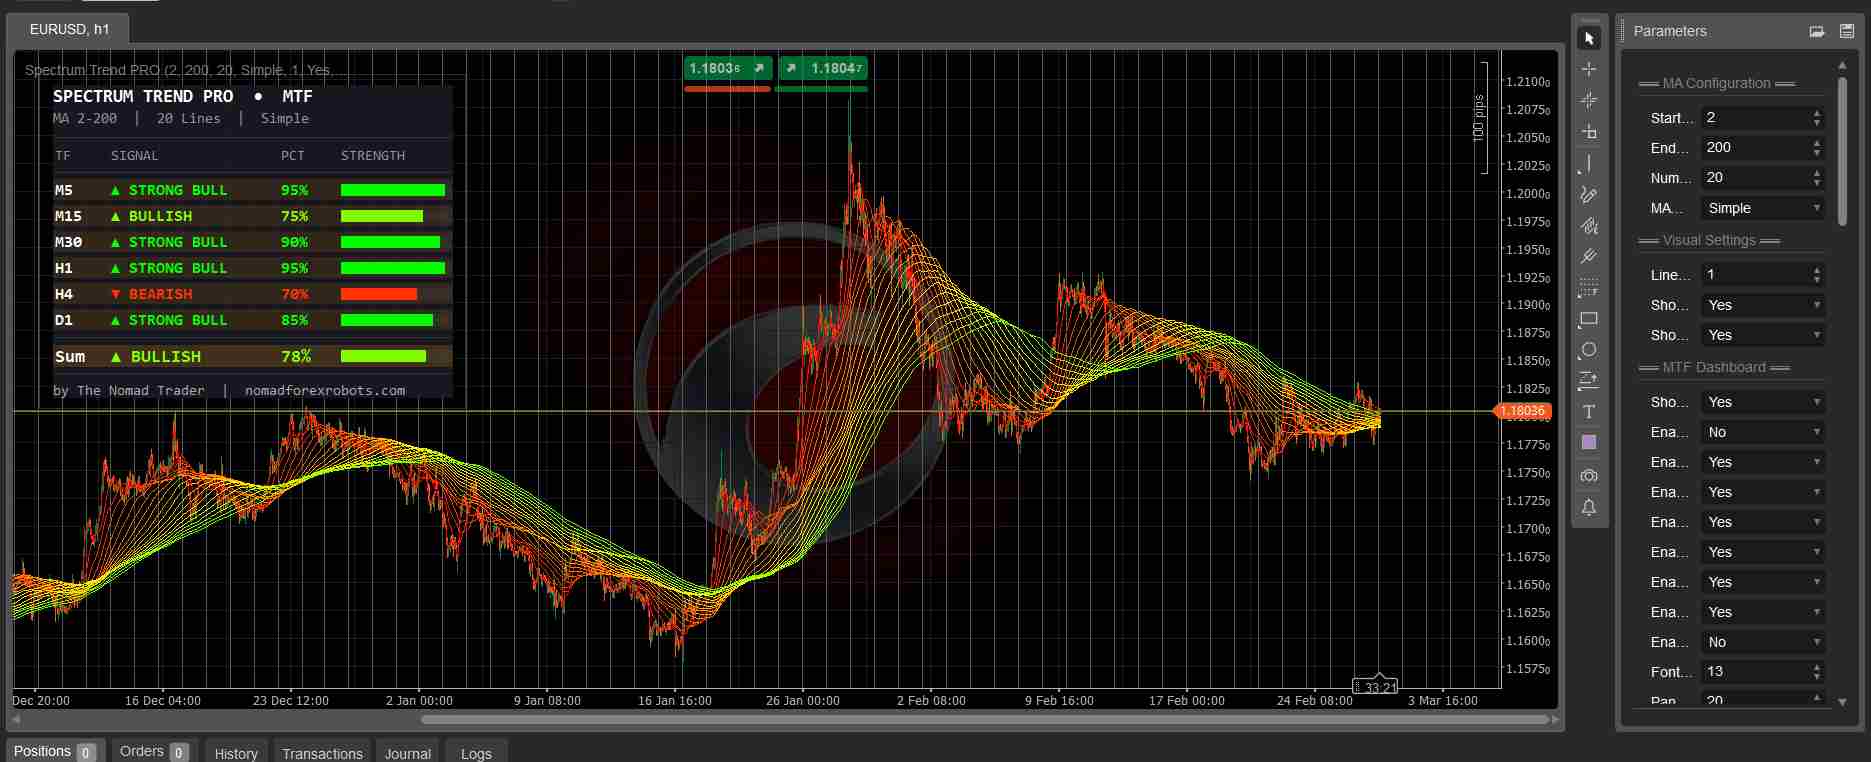
The rainbow spectrum drapes across your chart as an overlay. The MTF dashboard panel sits in the corner — scoring up to 8 timeframes simultaneously with signal labels, percentages, and color-coded strength bars.
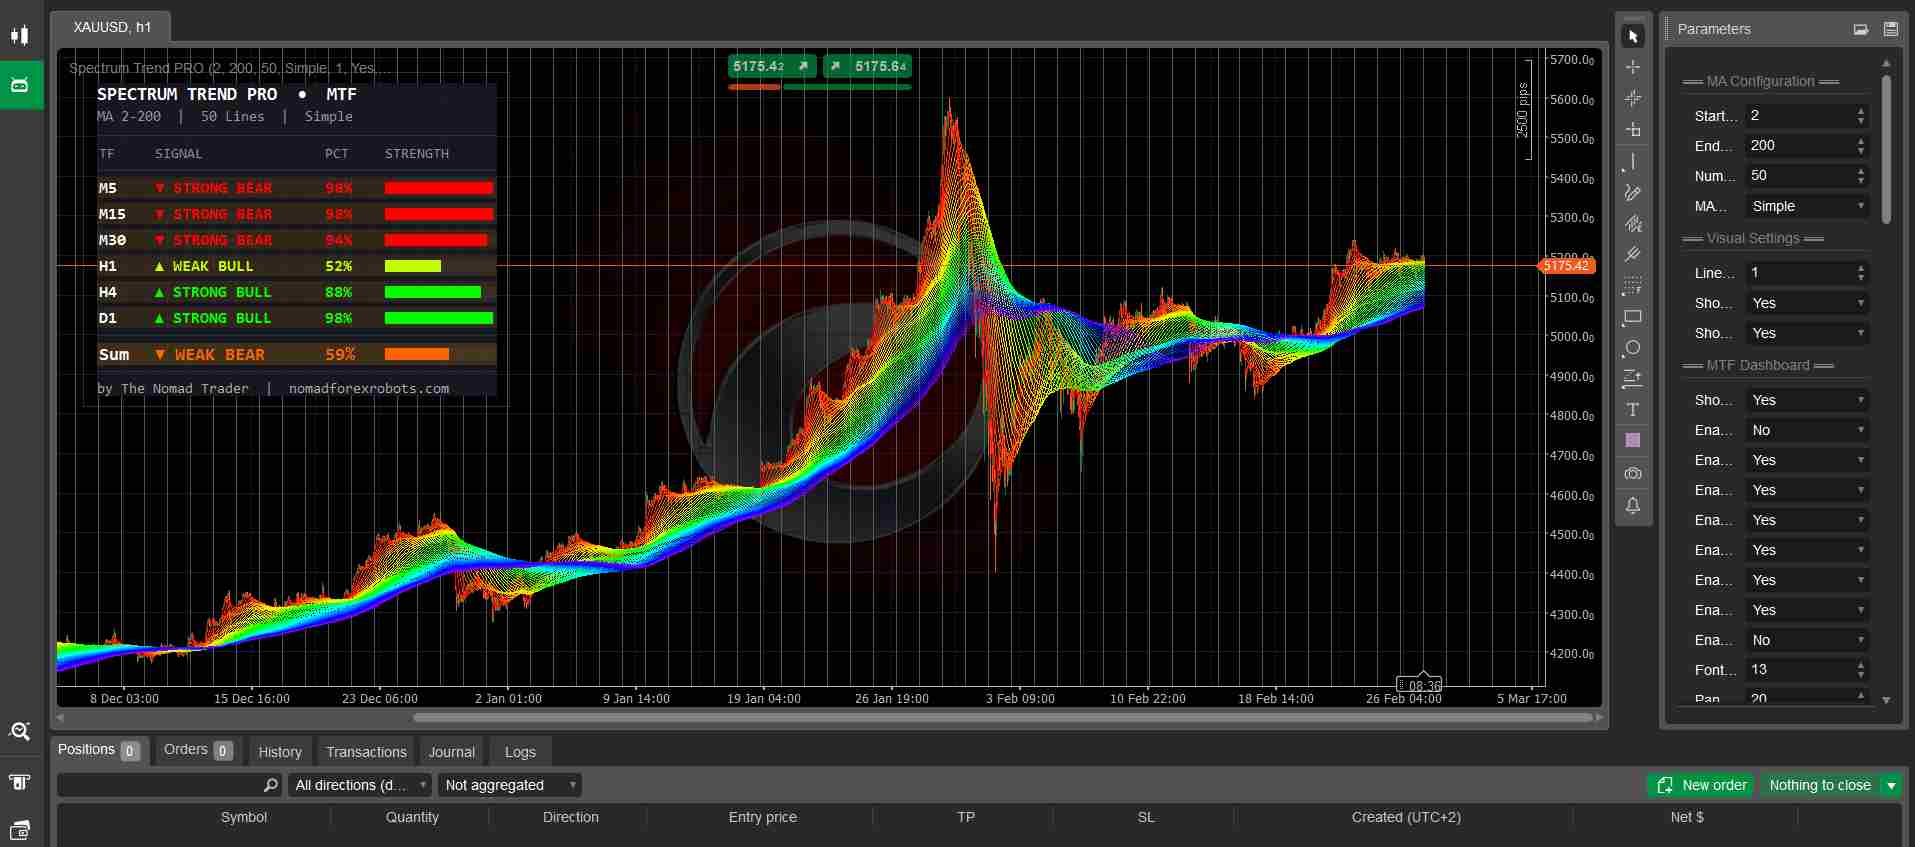
The mockup above shows a real-world scenario on Gold: lower timeframes in strong bear while H4 and D1 remain bullish. The Sum row instantly tells you it's a pullback — not a reversal.
Each enabled timeframe shows its own independent bull/bear percentage calculated from all 50 MAs. Seven signal levels from STRONG BEAR to STRONG BULL. Color-coded strength bars for instant visual read.
6 systems. One indicator.
Everything calculated automatically, displayed cleanly, designed to give you a decision — not more noise.
What the % actually means
The percentage tells you exactly how many of the MAs agree with the current price direction — independently calculated on each enabled timeframe.
3 proven approaches
cTrader vs MT5 — what's different
Both versions share the same core rainbow visualization and sentiment engine. The cTrader version goes further with a more advanced dashboard.
Also available: Spectrum Trend Pro for MT5 →
Running in under 2 minutes
No installer, no DLL, no broker restrictions. Just paste and build.
SpectrumTrendPro.algo immediately.Automate tab → Indicators → click New. Delete the default template code entirely.F6 (or click Build). Confirm zero errors in the output log.Indicators → select SpectrumTrendPro → OK.Everything under the hood
Get Spectrum Trend Pro MTF
50 moving averages. 8 timeframes. Compiled .algo file. One-time purchase.
Get it now — $100 →